

Mapping a Virus: Visualizing the Geography of COVID-19 in Michigan
May 7, 2020 - Diane Huhn
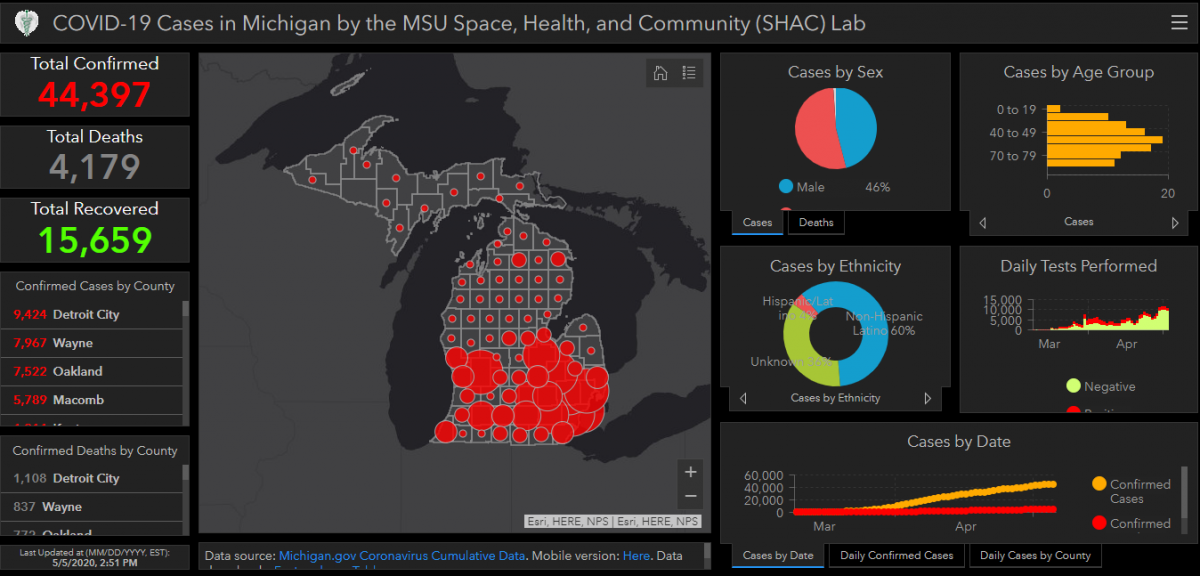
As cases of the novel coronavirus began spreading across the globe earlier this year, Jonnell Sanciangco, a Michigan State University (MSU) doctoral candidate specializing in spatial methodologies in the Department of Geography, Environment, and Spatial Sciences, began a routine of checking in on one of the few websites sharing daily COVID-19-related data at the time. The Coronavirus Resource Center website, popular among his colleagues, is hosted by the John Hopkins University Center for Systems Science and Engineering and features an ArcGIS dashboard – a configurable geographic information system web application that allows users to present real-time data visually via charts, graphs, maps, gauges, and other visually-engaging elements. The dashboard features data relating to daily and cumulative confirmed COVID-19 cases and deaths by country and region while also allowing insights into critical trends that help provide context to the data collected.
When the first cases of the virus began being detected in the state, Sanciangco, an expert in GIS, started wondering if a similar dashboard focused solely on Michigan could be of use to local and state healthcare and government officials and other interested parties, especially those needing to make decisions related to the outbreak. “I was thinking about it all night, and I told my wife, “You know, I can do this. I can put up a similar dashboard using just the Michigan data that is publicly available from the state.” So, she dared me to do it, and the next day I started putting it together,” said Sanciangco. “I’m quite familiar with the technology they used as I have been working with GIS for many years.”
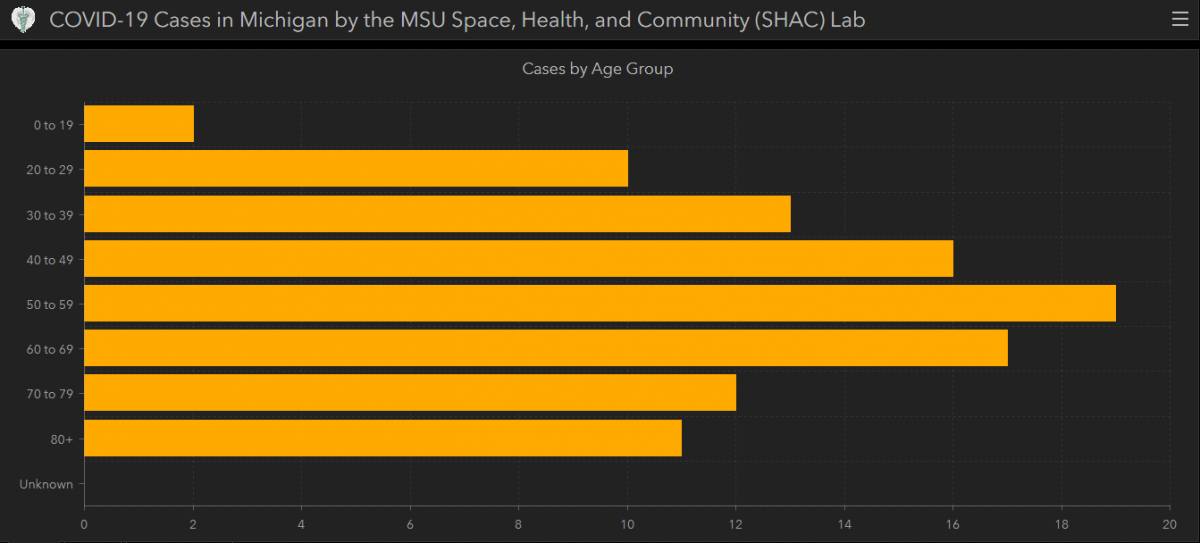
Sanciangco’s Michigan COVID-19 dashboard is updated daily with information provided by the state. The panel features data at the state and county level, and users can explore the information based on demographic characteristics such as sex, age groups, race, and ethnicity. Information regarding daily testing efforts in the state is also featured.
The dashboard is publicly available on the Space, Health, and Community (SHAC) Lab website. The SHAC Lab in the Department of Geography, Environment, and Spatial Sciences at MSU is a research laboratory that concentrates on the geographic and equity dimensions of public health and public health policy. Sanciangco is a member of the lab and became interested in relating programming and GIS to study patterns and prevalence of hospitalization due to mental health illnesses. He is currently working on managing a database of inpatient hospitalizations in Michigan. He wants to provide a comprehensive analysis of mental health hospitalization cases in Michigan from 2000 to 2016 based on three main topics – individual, hospital, and community levels.
“The COVID-19 data that Jonnell has been collecting from the state is laid out in tables and spreadsheets which is not always very easy to digest,” said Dr. Ashton Shortridge, Professor and Co-Director of the SHAC Lab. “The work that he is doing makes that data much more user-friendly. I feel that making this data from the state more readable by both the general public and by people who want to work more with the data is an important service.”
Sanciangco plans to continue updating the dashboard as long as the data is available, relevant, and useful. To date, the dashboard has been viewed more than 55,000. “The state sometimes changes the data that it is putting out, which means that I need to do some updates on my end, but it’s enabled me to add additional types of data,” said Sanciangco. “So, with that in mind, the site may continue to expand as the information that they provide changes and develops.”
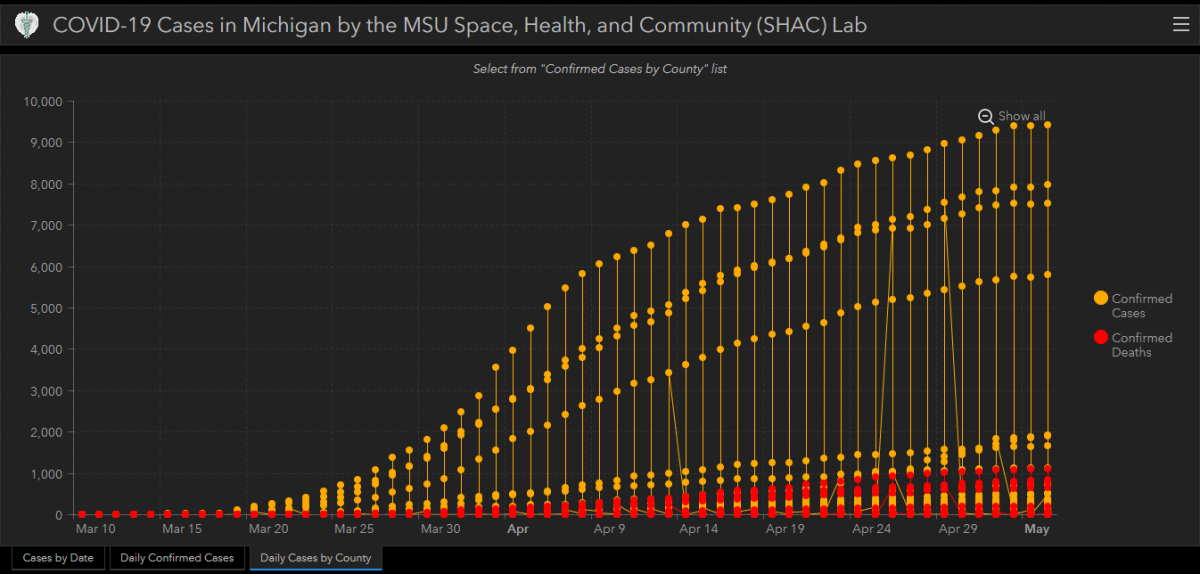
“One thing I find interesting about the map is that it shows spatial diffusion. When we look at the pattern of cases at the end of April in Michigan, we see the hotspot in southeastern Michigan diffusing across counties throughout that part of the state,” said Shortridge. Currently, rural counties that are closer to Detroit have more cases than rural counties in other parts of the state. If this diffusion process continues, adjacent counties will likely begin to see more cases. “Where you are matters. That is the key to the idea of diffusion. And that is hidden if we just look at a list of data by county. When we map it though, it becomes apparent to everyone what the pattern of the development of this disease looks like.”
To view the desktop and mobile versions of the dashboard, or learn more, visit the Space, Health, and Community (SHAC) Lab website.