PRECIPITATION
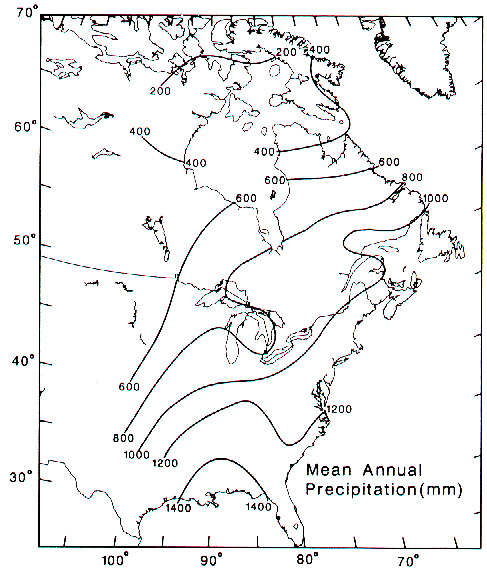
From a regional perspective, this is the pattern
of mean annual precipitation for eastern North America (below). Note
how, as distance from the moisture source (Gulf of Mexico and the
Atlantic) increases, precipitation decreases.
Source: Photograph by Randy Schaetzl, Professor of Geography - Michigan State University
Annual mean precipitation ranges from a maximum of more than 36 inches
in the southwestern Lower Peninsula to a minimum of fewer than 27 inches
in the northeastern Lower Peninsula. These variations result primarily
from statewide differences in the availability of moisture-laden air
associated with passing fronts and cyclonic storms. The lower
precipitation amounts in the north reflect a northward decrease in the
amount of water vapor present in the atmosphere that can interact with
these disturbances.
Air masses acquire water vapor
through transpiration by plants, evaporation from the soil, and most
important, directly from bodies of water. Large amounts of moisture,
however, can be acquired only from warm-water bodies such as tropical
oceans. Thus, the Great Lakes supply only a small percentage of the total
water that falls as rain or snow in the state; most of it originates in
tropical air masses that move north from the Gulf of Mexico. Since these
air masses originate in areas far south of Michigan, they most often reach
only the southern Lower Peninsula before being driven out by a passing
disturbance. Hence, average annual precipitation is highest in this area
and decreases to the north.
The state�s
precipitation which falls as snow, some of it that falls to the lee of the
Great Lakes originates as water vapor acquired from the lake surfaces
themselves. Only in these lake-effect snow areas is the contribution of
moisture from the Great Lakes important, elsewhere, the primary source of
moisture is the tropical air masses.
Local
differences in annual mean precipitation are related to either the Great
Lakes or to elevation. Cooler lake breezes advancing inland off the Great
Lakes during warm summer afternoons may destroy or weaken some
thundershowers in the coastal areas. Repeated often enough, this process
results in a somewhat lower amount of summertime precipitation than in the
inlands areas, which are unaffected by normal lake-breeze
pattens.
Lake-effect
snow usually falls from clouds with bases less than 5,000 ft in
height, and the greatest amounts from these storms consistently fall in
the most-elevated portions of the lee-shore areas. This fact suggests that
even the relatively subdued terrain features of
Michigan can modify certain local precipitation.
Source: Photograph by Randy Schaetzl, Professor of Geography - Michigan
State University
Within Michigan, we see a similar regional trend.
Precipitation is greatest in the SW corner, which is closest to the lakes
and to the Gulf. High upland areas, like the uplands near Gaylord
and the Huron Mountains, get more precipitation due to high amounts of lake effect
snow in winter. Low sites, and those farther east, get less
precipitation.
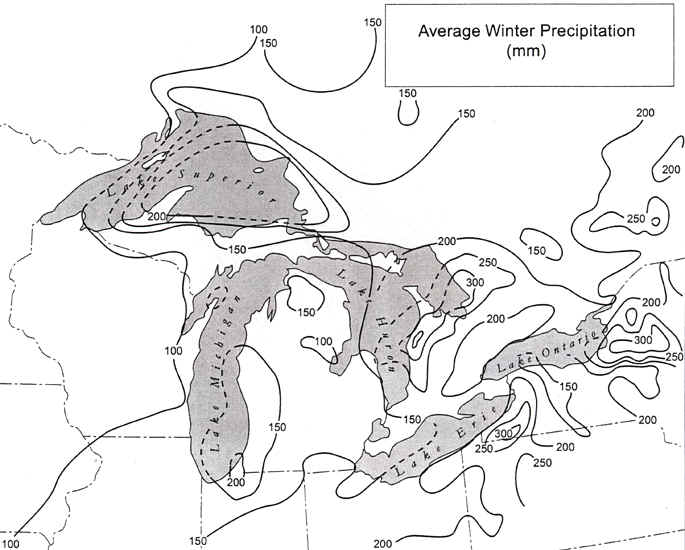
If we examine the pattern of precipitation on a seasonal basis,
additional details become apparent. Look at the map below, of
average wintertime precipitation.
Source: Michigan State University, Department of Geography
Note the low amounts of precipitation over the cold
lakes. And also note that the water evaporated off these lakes falls
as precipitation on their lee sides. In Michigan, we often ignore
the significant snowbelts that occur on the lee of Lake Huron (in Canada),
but this is a large, extensive snowbelt area. In general, wintertime
precipitation is closely associated with the lakes--dry on the windward
sides and wet on the lee sides.
Climagraphs are a
useful way of examining annual and monthly patterns of
precipitation. For example, is spring the wettest time of year in
our region, or fall? The map below, which shows a series of
climagraphs for the Great Lakes region, clearly makes several
points:
1. In the western Great Lakes region, there is a distinct late
summer maximum of precipitation,
2. That pattern falls apart in the
southern lakes, where some sites have a springtime precipitation max,
while others have nearly uniform precipitation year-round,
3. There is
a distinct south-to-north decrease in precipitation totals,
4. Winters
are "drier" on the western sides of the lakes.
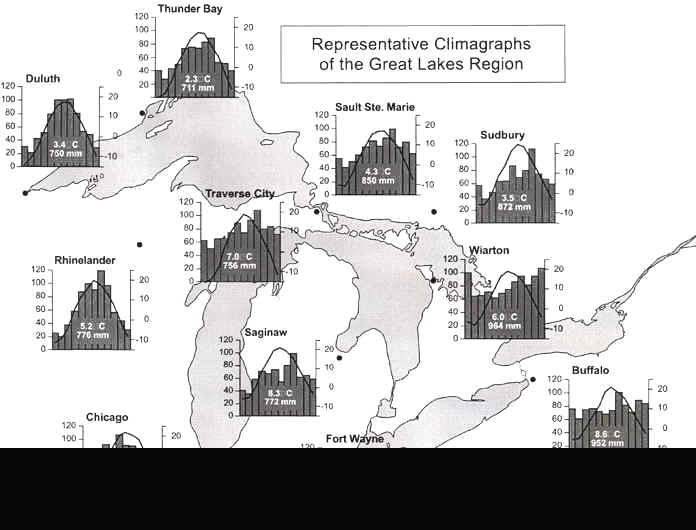
Source: Michigan State University, Department of Geography
The amount of moisture available to plants is a function of the amount that falls (precipitation, or P) minus moisture need (evapotransipration, or ET). Evapotranspiration is a function of air temperature, wind, sunshine, and humidity. The map below shows that Michigan has, for the most part, and excess of P over ET, meaning that, in a normal year, plants have adequate precipitation to grow, and the excess of water allows for deep leaching to occur in soils. It also shows that the UP is essentially "wetter" than the lower peninsula, even though the latter gets more precipitation in many parts.
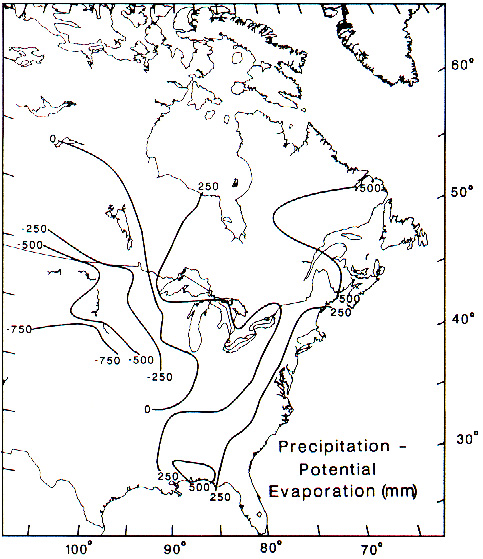
Source: Unknown
Parts of the text on this page have been modified from L.M. Sommers' book entitled, "Michigan: A Geography".
This material has been compiled for educational use only, and may not be reproduced without permission. One copy may be printed for personal use. Please contact Randall Schaetzl (soils@msu.edu) for more information or permissions.